In 1923, Edwin Hubble discovered the universe—or rather, he discovered a star, and humans learned that the Milky Way wasn’t the whole of the cosmos. Less than 100 years later, thanks to the telescope named after him, NASA scientists estimate the universe contains at least 100 billion galaxies, and who-knows-what beyond that. The exponential growth of astronomical data collected since Hubble’s time is absolutely staggering, and it developed in tandem with the revolutionary increase in computing power over an even shorter span, which enabled the birth and mutant growth of the internet.
Modern “maps” of the internet can indeed look like sprawling clusters of star systems, pulsing with light and color. But the “weird combination of physical and conceptual things,” Betsy Mason remarks at Wired, results in such an abstract entity that it can be visually illustrated with an almost unlimited number of graphic techniques to represent its hundreds of millions of users. When the internet began as ARPANET in the late sixties, it included a total of four locations, all within a few hundred miles of each other on the West Coast of the United States. (See a sketch of the first four “nodes” from 1969 here.)
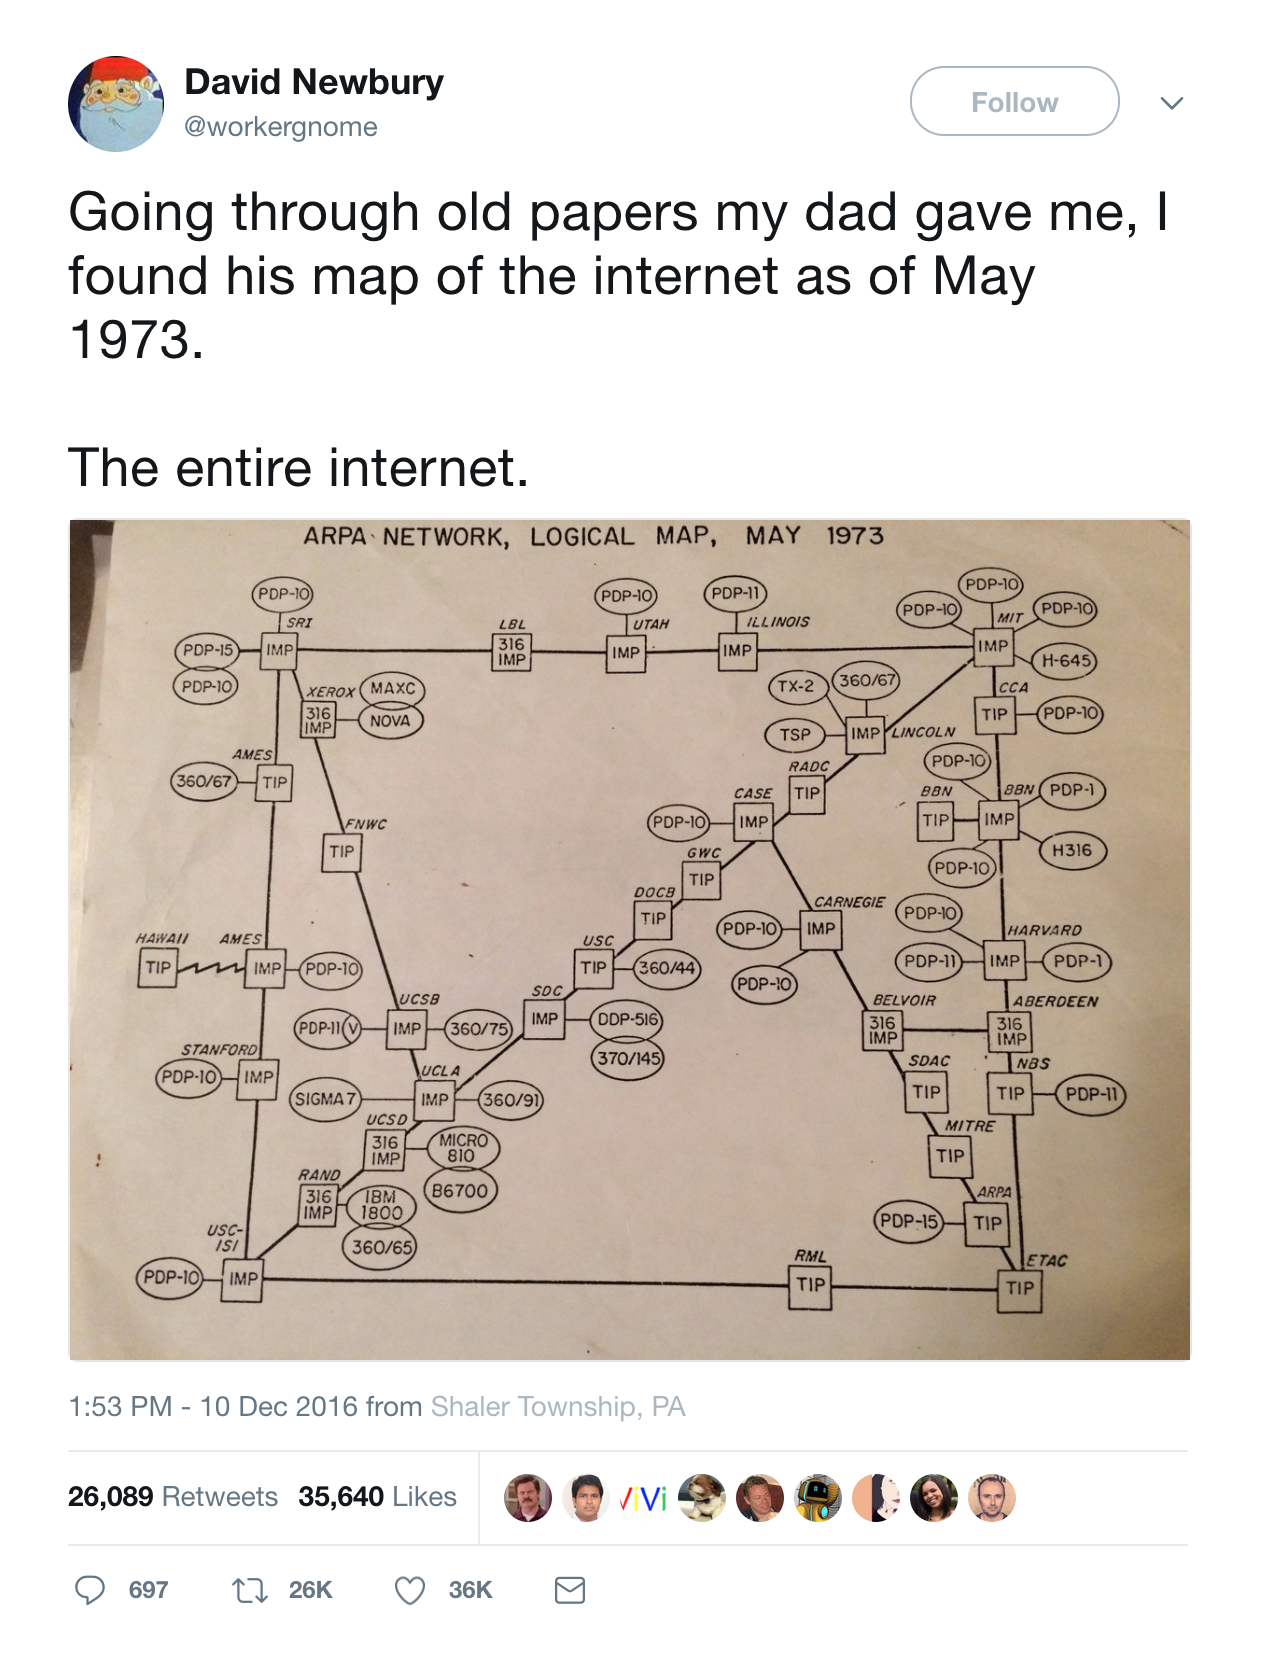
By 1973, the number of nodes had grown from U.C.L.A, the Stanford Research Institute, U.C. Santa Barbara, and the University of Utah to include locations all over the Midwest and East Coast, from Harvard to Case Western Reserve University to the Carnegie Mellon School of Computer Science in Pittsburgh, where David Newbury’s father worked (and still works). Among his father’s papers, Newbury found the map above from May of ’73, showing what seemed like tremendous growth in only a few short years.

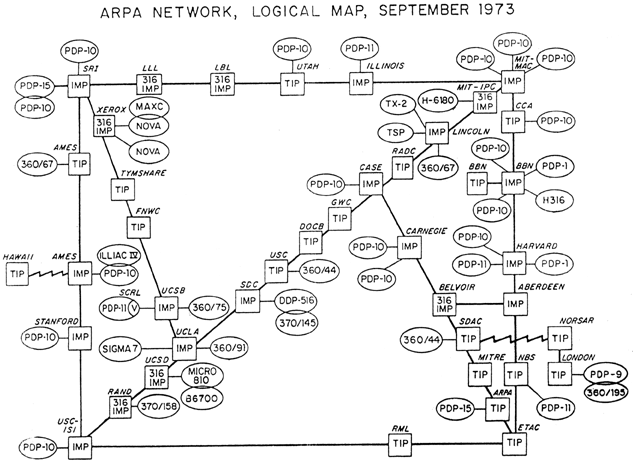
The map is not geographical but schematic, with 36 square “nodes”—early routers—and 42 oval computer hosts (one popular mainframe, the massive PDP-10, is sprinkled throughout), and only naming a few key locations. Significantly, Hawaii appears as a node, linked to the mainland by satellite. Just above, you can see an update from just a few months later, now representing 40 nodes and 45 computers. “The network,” writes Selina Chang, “became international: a satellite link connected ARPANET to nodes in Norway and London, sending 2.9 million packets of information every day.”
These early networks of global interconnectivity, created by the Defense Department and used mostly by scientists, predate Tim Berners-Lee and CERN’s development of the World Wide Web in 1991, which opened up the enormous, expanding alternate universe we know as the internet today (and was, coincidentally, invented around the same time as the Hubble Telescope). Though maps aren’t territories (a 1977 ARPANET “logical map” disclaims total accuracy in a note at the bottom), these early representations of the internet resemble medieval maps of the cosmos next to the beautiful complexity of glowing colors we see in 21st century infographics like the authoritatively-named “The Internet Map.”
Related Content:
The History of the Internet in 8 Minutes
What Happens on the Internet in 60 Seconds
The Internet Imagined in 1969
Josh Jones is a writer and musician based in Durham, NC. Follow him at @jdmagness


