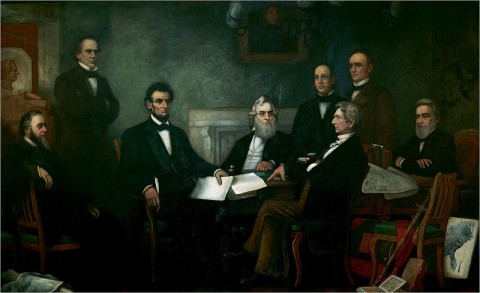
If you look closely at Francis Bicknell Carpenter’s 1864 painting “First Reading of the Emancipation Proclamation by President Lincoln” (see above — click image for a larger version) you will notice a map in the lower right-hand corner, next to the group that includes Lincoln and his cabinet.
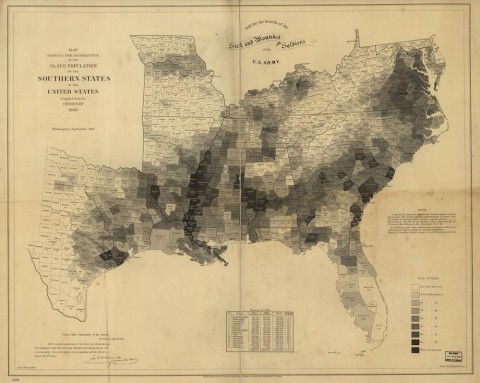
The map in the painting was a document Lincoln consulted often during the Civil War. It was created by the United States Coast Survey using data from the 1860 Census to show the geographic distribution of the South’s vast slave population.
Carpenter lived in the White House for six months while working on his painting, and according to historian Susan Schulten, author of Mapping the Nation: History and Cartography in 19th Century America, the artist encountered Lincoln poring over the map on more than one occasion.
The map (click it to see a larger version) is an early example of statistical cartography. The slave population of each county is represented numerically and through a graded scale of shading. The higher the number of slaves, the darker the shade. In a 2010 piece in the New York Times “Opinionator” blog, Schulten writes:
The map reaffirmed the belief of many in the Union that secession was driven not by a notion of “state rights,” but by the defense of a labor system. A table at the lower edge of the map measured each state’s slave population, and contemporaries would have immediately noticed that this corresponded closely to the order of secession. South Carolina, which led the rebellion, was one of two states which enslaved a majority of its population, a fact starkly represented on the map.
The map helped Lincoln visualize what he was up against. Areas along the Atlantic coast and Mississippi River, for example, are darkly shaded. The white populace in those areas was fanatically resistant to emancipation. “Conversely,” writes Schulten, “the map illustrated the degree to which entire regions — like eastern Tennessee and western Virginia — were virtually devoid of slavery, and thus potential sources of resistance to secession. Such a map might have reinforced President Abraham Lincoln’s belief that secession was animated by a minority and could be reversed if Southern Unionists were given sufficient time and support.”
For more on Lincoln’s map, visit Rebecca Onion’s post at Slate.
Related Content:
“Ask a Slave” by Azie Dungey Sets the Historical Record Straight in a New Web Series
The Civil War and Reconstruction: A Free Course
The Poetry of Abraham Lincoln
The Last Surviving Witness of the Lincoln Assassination
African-American History: Modern Freedom Struggle – YouTube – iTunes – Clay Carson, Stanford (in our collection of 750 Free Online Courses)
