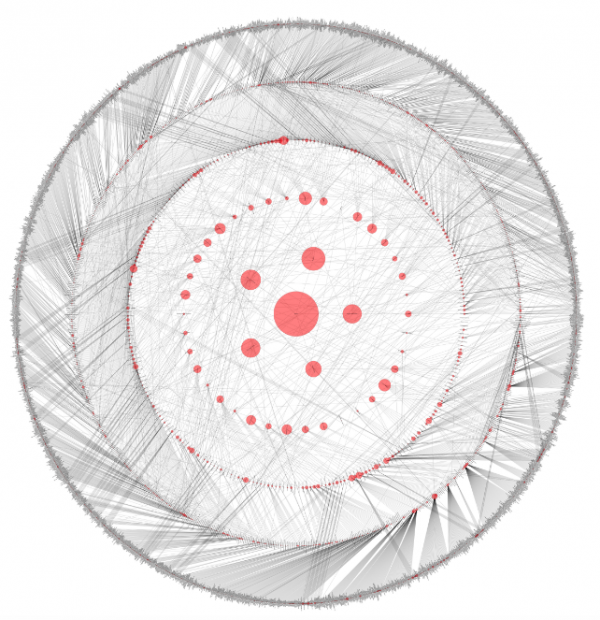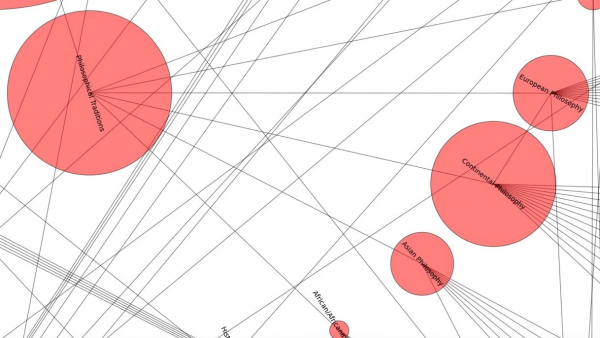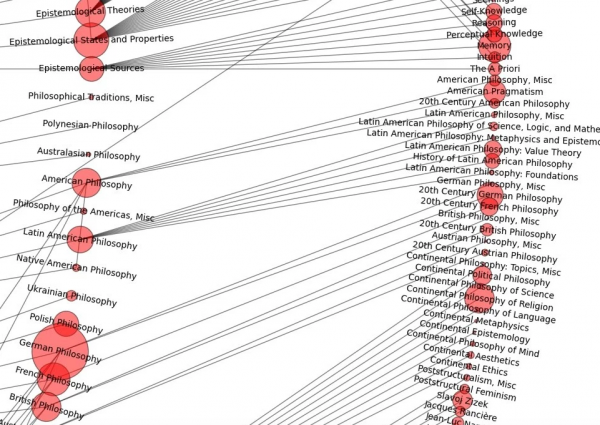
Daily Nous, a website about philosophy and the philosophy profession, recently featured a detailed mapping of the entire discipline of philosophy, created by an enterprising French grad student, Valentin Lageard. Drawing on a taxonomy provided by PhilPapers, Lageard used NetworkX (a Python software package that lets you study the structure and dynamics of complex networks) to map out the major fields of philosophy, and show how they relate to various sub-fields and even sub-sub-fields. The image above shows the complete map, revealing the astonishing size of philosophy as an overall field. The images below let you see what happens when you zoom in and move down to different levels.

To explore the map, head over to Daily Nous–or open this image, click on it, wait for it to expand (it takes a second), and then start maneuvering through the networks.
If you’re interested in seeing philosophy diagrammed from another point of view, check out this post in our archive: The History of Philosophy, from 600 B.C.E. to 1935, Visualized in Two Massive, 44-Foot High Diagrams.

If you would like to sign up for Open Culture’s free email newsletter, please find it here. It’s a great way to see our new posts, all bundled in one email, each day.
If you would like to support the mission of Open Culture, consider making a donation to our site. It’s hard to rely 100% on ads, and your contributions will help us continue providing the best free cultural and educational materials to learners everywhere. You can contribute through PayPal, Patreon, and Venmo (@openculture). Thanks!
Related Content:
The History of Philosophy Visualized
Free Online Philosophy Courses
Leo Strauss: 15 Political Philosophy Courses Online


Mind blown!
It isn’t clear what the connections in the graph represent, they aren’t labelled.
If this was written in dot, the handy graph defining language used by graphviz, and omnigraffle, it’d be useful to have the original dot file, so this could be corrected.
https://en.wikipedia.org/wiki/DOT_language?wprov=sfsi1
This is really a load of old cobblers, isn’t it?
I agree with Dr. Rowan.
I thought the tidiness of this graph very suspicious. It is in fact not a “map of the discipline of philosophy” it’s a map of the bibliographic hierarchies of the website Philpapers. It does not represent the overlap or interconnection of the thought that these hierarchies attempt to describe.
The link to “The History of Philosophy Visualised” is in fact much more revealing, as it visualises the distribution of influence of different philosophers. That again is based on Wikipedia depictions and does not emerge from the source texts themselves.
These should be thought of as directions to take DH visualisations, but please, describe your sources more accurately.
A next step might be to visualise the tags of each of the papers listed in Phil papers, to show the actual interconnections between the literature. That would be a much more substantive representation.